Recommendations are not an invention of the Internet - they existed long before. We gladly recommend products, films, TV series, […] of which we are convinced, to our friends and relatives. Therefore, it’s not surprising that we also come across recommendations on the Internet - be it Amazon, who wants to sell us similar products, or Netflix, who shows us how well a TV series matches our profile.
The difference, however, is that e.g. Amazon and Netflix try to determine in advance which product or TV series we might like. One can spot multiple types of suggestions at Amazons website:
- Often bought together
- Customers who bought this item also bought […]
- You probably like […], too
But: How does Amazon manage to create individual recommendations? Although, statistics on sales are available, they are of little help here - since of course one wants to recommend products which are not part of the mainstream, too. It seems obvious, that a different approach is therefore required at this point.
Two approaches have been adopted in the area of recommendations:
- Content-based Filtering
- Collaborative Filtering
Content-based Filtering
As the name implies, Content-based Filtering (CBF) measures the similarity of two objects by comparing their properties. Taking a TV series as an example, the following properties might be useful:
- Year
- Genre
- Country
- Duration
- Producer
A recommendation is then simple - use all TV series, that a customer bought, watched and rated as source and search for a TV series with the same properties (exact match) or similar properties (best match). If these information are not available, the currently viewed TV series may be used as source. In this context, tracking cookies are also useful, as they follow our route through the web and track, what websites we visited.
Let’s stick to the example: I filled the table below with properties, which I think are the most useful.
| Arrow | The Flash | Breaking Bad | The Simpsons | |
| Year | 2012 | 2014 | 2008 | 1989 |
| Genre | Crime, Action, Drama | Crime, Action, Drama | Drama | Comedy |
| Country | USA | USA | USA | USA |
| Duration | 42 min. | 42 min. | 47 min. | 22 min. |
| Producer | DC Comics | DC Comics | Vince Gilligan | 20th Century Fox |
Imagine, I am a fan of Arrow - what would I probably be watching next? You guessed it: I’m more likely to watch The Flash than Breaking Bad, because the latter has fewer matches with the original title. The Simpsons wouldn’t probably be recommended to me, as the only similarity is the country of production. The exact match in this case would be The Flash, the best match is Breaking Bad. So far, so logical.
💡 The recommendation becomes more individual if a customer can rate which criteria are the most important.
However, one disadvantage of this approach is, that not every product can be divided into categories and properties and thus be compared to each other. Additionally, there’s a risk of getting stuck in the same product category. The consequence might be, that only TV series based on TV series are recommended.
Personally, I like to watch Arrow, but I’m not only interested in similar TV series - I would also like to buy arrows and a bow. The question is: “How can arrow and a bow be recommended to me?“. It’s obvious to simply look at what other customers bought. This process is called Collaborative Filtering.
Collaborative Filtering
Collaborative filtering is a method of making recommendations (filtering) based on the interests of a list of customers (collaborating). Hence, the customers work together involuntary, so to say. The underlying assumption of this approach is that if person A has the same opinion as person B on an issue, A is more likely to have B’s opinion on a different issue than that of a randomly chosen person.
Instead of comparing properties of products, Collaborative Filtering tries to find similarities between customers. One important thing to keep in mind is, that the similarity is entirely based on the given rating to a specific product. If two customers gave the same ratings to 5 TV series, one can consider them to be equal - despite the fact, that their age or gender might be different.
Memory-based Filtering
In this context, Memory-based Filtering can be used to determine the n most similar customers. For this purpose, statistical techniques are applied to the entire dataset. To better understand the concept, let’s create a simple dataset first.
| Jake | Lucy | Emily | Nicolai | |
| Arrow | 5 | 3 | 1 | 5 |
| The Flash | 5 | 2 | 1 | 4 |
| Breaking Bad | 2 | 5 | 2 | 4 |
| The Simpsons | 3 | 4 | 3 | 1 |
| Similarity | 0.93 | 0.84 | 0.68 | 1 |
The dataset of our Content-based Filtering example from the beginning is extended to include ratings of Jake, Lucy, Emily and me. Just like Amazon, a rating with value 5 indicates overall satisfaction, whereas a value of 1 means the opposite. For calculating the similarity (last row), I use the formula for centered cosine.
💡 The formula for centered cosine is the same as that for Pearson correlation coefficient (PCC).
Suppose, I wanted to calculate the measure for Jake and me - it would look like this:
According to the Cauchy–Schwarz inequality, PCC has a value between +1 and −1, where 1 is total positive linear correlation, 0 is no linear correlation, and −1 is total negative linear correlation.
The calculated score 0.93 is close to 1, which means that Jake and I share common interests. That’s not surprising, as we gave similar ratings to the TV series. Hence, if Jake decides to buy an arrow and a bow on Amazon, it’s likely that I get suggested the same products.
But: This approach also has its disadvantages. As the number of customers increases, so does the computing effort - since theoretically every customer has to be compared with every other one. Further, if the company has a large product range (like Amazon), customers may rarely have similarities. While Jake prefers to watch and rate the TV series in English, I’m a fan of the German version. The result is, that we both rated Arrow, but in a different version and therefore not the same product - although we have the same taste.
Model-based Filtering
It seems obvious, that an approach is needed to limit the number of comparisons. Instead of looking at customer-to-customer similarities, Model-based Filtering tries to identify superior properties in the dataset in order to create groups (clusters) out of them. As a result, I don’t have to be compared with Jake anymore, but with the group of e.g. ”Comic Fans“.
Note: It is not necessary, to know the properties of the groups in advance.
k-means Clustering
A simple approach of Model-based Filtering is k-means clustering. The goal of this algorithm is to find a number of k groups (clusters) in the data. It does so by iteratively assigning each data point to the cluster with the nearest centroid. For the first iteration, these centroids are randomly chosen. Next, the centroid of each cluster is recalculated, and each data point is assigned again […] until stopping criteria is met (i.e., no data points change clusters, the sum of the distances is minimized, or some maximum number of iterations is reached).
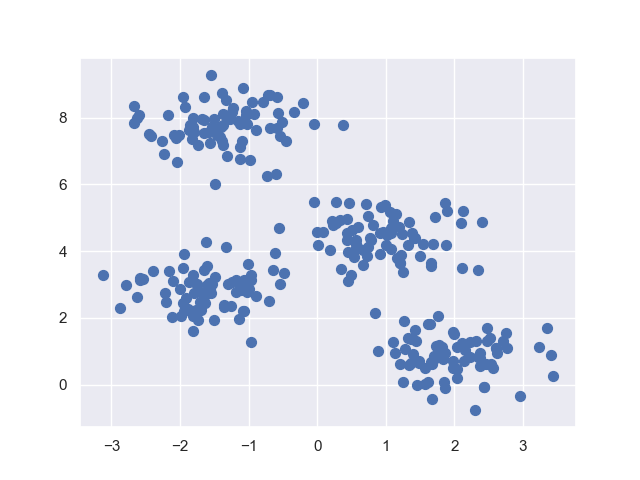
Let’s create a sample dataset and try to identify clusters using k-means clustering. I use the Python packages sklearn to randomly create data points and matplotlib as well as seaborn for a scatter plot. You can find the code snippet below.
1#!python32# -*- coding: utf-8 -*-34""" Author: nicolai92 """56from sklearn.datasets.samples_generator import make_blobs7import numpy as np8import matplotlib.pyplot as plt9import seaborn as sns1011sns.set() # Use seaborn for plot1213X, Y = make_blobs(n_samples=300, centers=4, cluster_std=0.60, random_state=0)14plt.scatter(X[:, 0], X[:, 1], s=50)15plt.show(block=True)
Running the code snippet will show a figure like the following. Since we can obviously make out about 4 clusters, we now attempt to create them using k-means. Next, we assign each data point to one out of those 4 clusters.

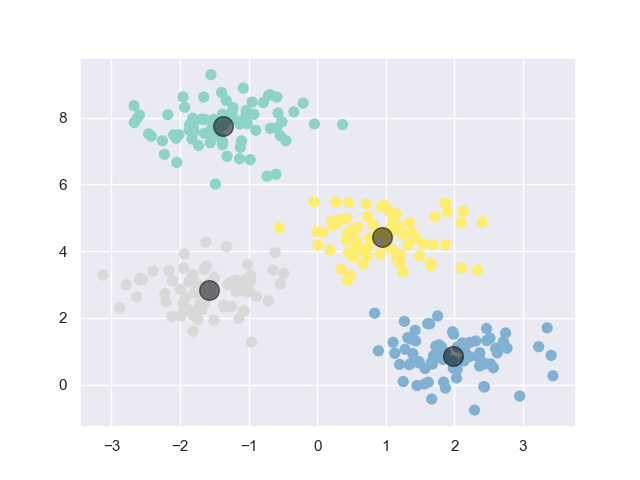
The package sklearn ships with an implementation of the k-means algorithm. Let’s extend the code snippet to finally create the clusters and assign the data points. Note, that in line 8 we have to explicitly define how many clusters to create — here it’s 4.
1#!python32# -*- coding: utf-8 -*-34""" Author: nicolai92 """56from sklearn.cluster import KMeans78kmeans = KMeans(n_clusters=4)9kmeans.fit(X)10y_kmeans = kmeans.predict(X)1112plt.scatter(X[:, 0], X[:, 1], c=y_kmeans, s=50, cmap='Set3')1314centers = kmeans.cluster_centers_15plt.scatter(centers[:, 0], centers[:, 1], c='black', s=200, alpha=0.5)1617plt.show(block=True)
The output of the extended script is a scatter plot, whereas each color (green, yellow, gray, blue) defines a cluster. Now, the data points are assigned to the cluster with the nearest centroid — highlighted with a black circle.

But: The clusters can depend on the choice of the initially chosen centroids. It’s therefore recommended to randomly select centroids at the beginning and run the k-means algorithm multiple times.
Further, Collaborative Filtering in general also has it’s disadvantages. Problems occur, if a product was released shortly and has no ratings or just a few. Hence, it’s advisable to combine Content-based Filtering and Collaborative Filtering.
And that’s how Amazon works?
What exactly happens behind the scenes at Amazon is kept under lock and key. The last more detailed information came from a 2003 article and a patent, but it’s assumed that the fundamentals of the system have remained the same.